Beyond the Classroom Food Chain: How Citizen Science is Mapping the Complexity of Life on Earth

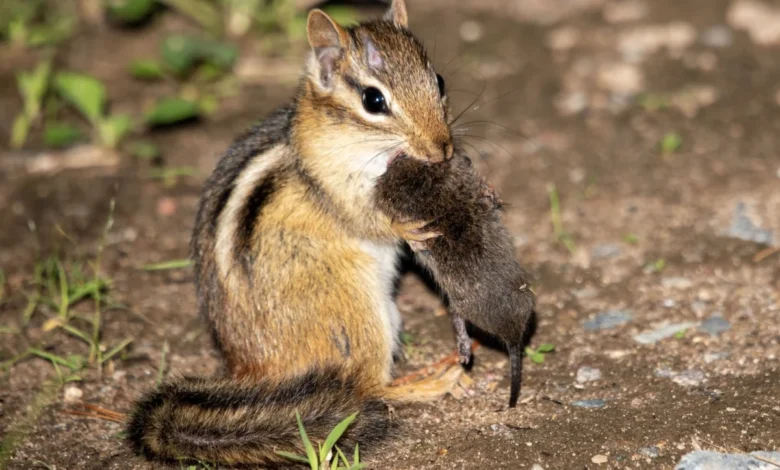
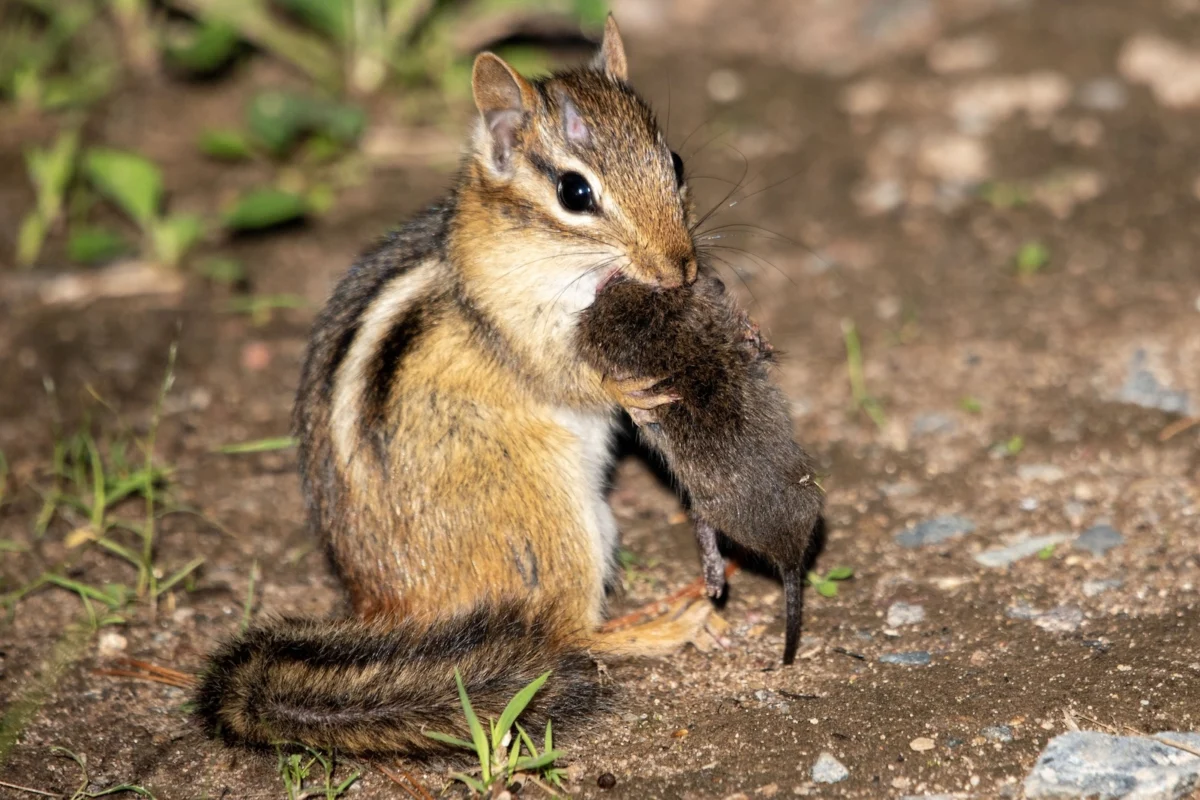
The simplified food chains taught in primary school curricula—the rat consuming garden crops, the ermine preying upon the rat, and the eagle eventually targeting the ermine—provide a pedagogical foundation for understanding energy transfer, yet they fail to capture the profound, chaotic, and often brutal complexity of natural ecosystems. In reality, these interactions are not linear pathways but intricate, multidimensional webs. Parasites, such as ticks and helminths, exploit the predators themselves, while scavengers like ants decompose the remains of apex predators, cycling nutrients back into the soil. Some species even exhibit behaviors that defy traditional models, such as the infanticide observed in rodent populations, which effectively turns the species into its own predator. Capturing the full scope of these interactions has long been a logistical nightmare for ecologists, requiring years of arduous field observation, nest monitoring, and the analysis of animal scat to reconstruct dietary habits.
A Technological Shift in Ecological Data Collection
A revolutionary change is currently underway, facilitated by the intersection of digital technology and public participation. The citizen science project Who Eats Whom has emerged as a high-tech repository for ecological data, leveraging the vast, pre-existing infrastructure of the iNaturalist social network. By utilizing the thousands of photos uploaded daily by amateur naturalists, scientists are now able to track biological interactions—predation, pollination, and herbivory—at a global scale that was previously impossible for individual research teams to achieve.
The project currently encompasses approximately 17,000 documented interactions involving 5,700 distinct species across more than 100 countries. This transition from manual field observation to data-driven crowdsourcing represents a fundamental shift in how biodiversity is monitored. As Bradley Allf, an ecologist formerly at North Carolina State University and now at Colorado State University, explains, the traditional model of an individual scientist trailing snakes for weeks in the hope of witnessing a singular feeding event is no longer the sole avenue for discovery. Crowdsourcing allows for the aggregation of millions of "snapshots" that, when combined, create a high-resolution map of ecosystem dynamics.
Chronology and Development of the Platform
The evolution of Who Eats Whom can be traced through the following developmental milestones:
- Pre-2020: Data on species interactions remained siloed within peer-reviewed academic journals, museum records, and the anecdotal logs of field researchers. The "bottleneck" of data acquisition meant that ecological models were often based on sparse, outdated information.
- 2020–2023: The rise of high-quality smartphone photography and the mass adoption of the iNaturalist platform provided a massive, decentralized, and georeferenced dataset.
- 2024: The formal launch and publication of the Who Eats Whom project in the journal PLOS Biology solidified the methodology. The team, led by Allf and computer scientist Aditi Mallavarapu, demonstrated that machine-readable interaction data could be extracted from citizen-uploaded images at a scale sufficient for longitudinal study.
- Present Day: The database serves as a live, interactive map where users can visualize complex food webs, identifying not only who eats whom, but also the specific plants that sustain the pollinators that sustain the food chain.
The Power of "Negative Data"
A critical component of this project is the analysis of "negative data"—the identification of what is not being observed. Aditi Mallavarapu notes that by comparing current feeding patterns with historical records, researchers can identify subtle shifts in animal behavior that may signal ecosystem stress. "If we look back five years, there have been documented changes in the feeding patterns of various animals," Mallavarapu explains. "By focusing on the gaps in our observations, we can start to ask why certain interactions are disappearing or why new, atypical prey items are appearing."
For instance, the interactive food web hosted on the project’s site reveals that the red-tailed hawk, a common North American raptor, displays a far broader diet than previously mapped, including a variety of small mammals and avian prey that rely on specific local flora. Similarly, the goldenrod crab spider—a master of camouflage—is shown to capture Western honey bees, which in turn are responsible for the pollination of plants ranging from honeysuckles to thistles. This "messiness" is precisely what the platform aims to document, acknowledging that energy transfer in nature is rarely a clean, direct line.
Implications for Climate Change and Conservation
The broader implications of this project are directly tied to the urgent challenges posed by climate change. As global temperatures rise, species are migrating toward the poles or to higher elevations to find cooler microclimates. This forced migration leads to the "reshuffling" of ecosystems, where native species are forced to compete or interact with new arrivals.
Peter Roopnarine, curator of invertebrate zoology and geology at the California Academy of Sciences, emphasizes that data acquisition is the greatest challenge to conservation. "These interactions are often ephemeral," says Roopnarine. "They might happen once in the lifetime of a species, in a remote location, and then be lost to history. Having a global army of people with cameras allows us to catch these ‘once-in-a-lifetime’ moments."
Furthermore, the data is vital for tracking the impact of invasive species. When a non-native predator, such as the lionfish, invades a reef, it can decimate local populations before scientists even have the chance to conduct a formal study. By monitoring the "menu" of these invasive species through citizen observations, conservationists can identify at-risk native populations and prioritize them for protection.
Beyond Habitat Protection: The Need for Relationships
The project reinforces a growing consensus among ecologists: conservation must move beyond the static concept of "protected areas." While preserving land and sea is a necessary first step, it is insufficient if the biological relationships—the "interaction architecture"—of those ecosystems are broken.
"Species don’t just need space; they don’t just need a habitat," Allf argues. "They need the relationships that allow them to survive." These relationships include the presence of specific prey, the availability of host plants, and the existence of stable pollinator networks. If a conservation area preserves the physical environment but fails to account for the disappearance of a key prey species or the arrival of a disruptive invasive competitor, the ecosystem will continue to decline.
Future Directions
As Who Eats Whom continues to grow, it serves as a testament to the utility of public engagement in scientific research. By gamifying the documentation of nature, the platform incentivizes participants to look closer at their surroundings, effectively turning everyday hikers, gardeners, and photographers into data-gathering assets.
The next phase of the project involves integrating predictive modeling. By using the current database as a baseline, researchers hope to forecast how food webs might look in the coming decades under various climate change scenarios. This would provide policymakers with the necessary evidence to implement dynamic conservation strategies—such as flexible "corridors" for migrating species or targeted intervention programs for native populations experiencing novel predation pressures.
In a world where biodiversity loss is accelerating, the ability to document the "messy" truth of ecological interactions is more than an academic exercise. It is a vital diagnostic tool. By understanding the intricate, often unseen connections that sustain life, humanity may yet find the leverage required to stabilize the systems upon which all life—including our own—depends.
Related posts: