Content Marketing Metrics To Track
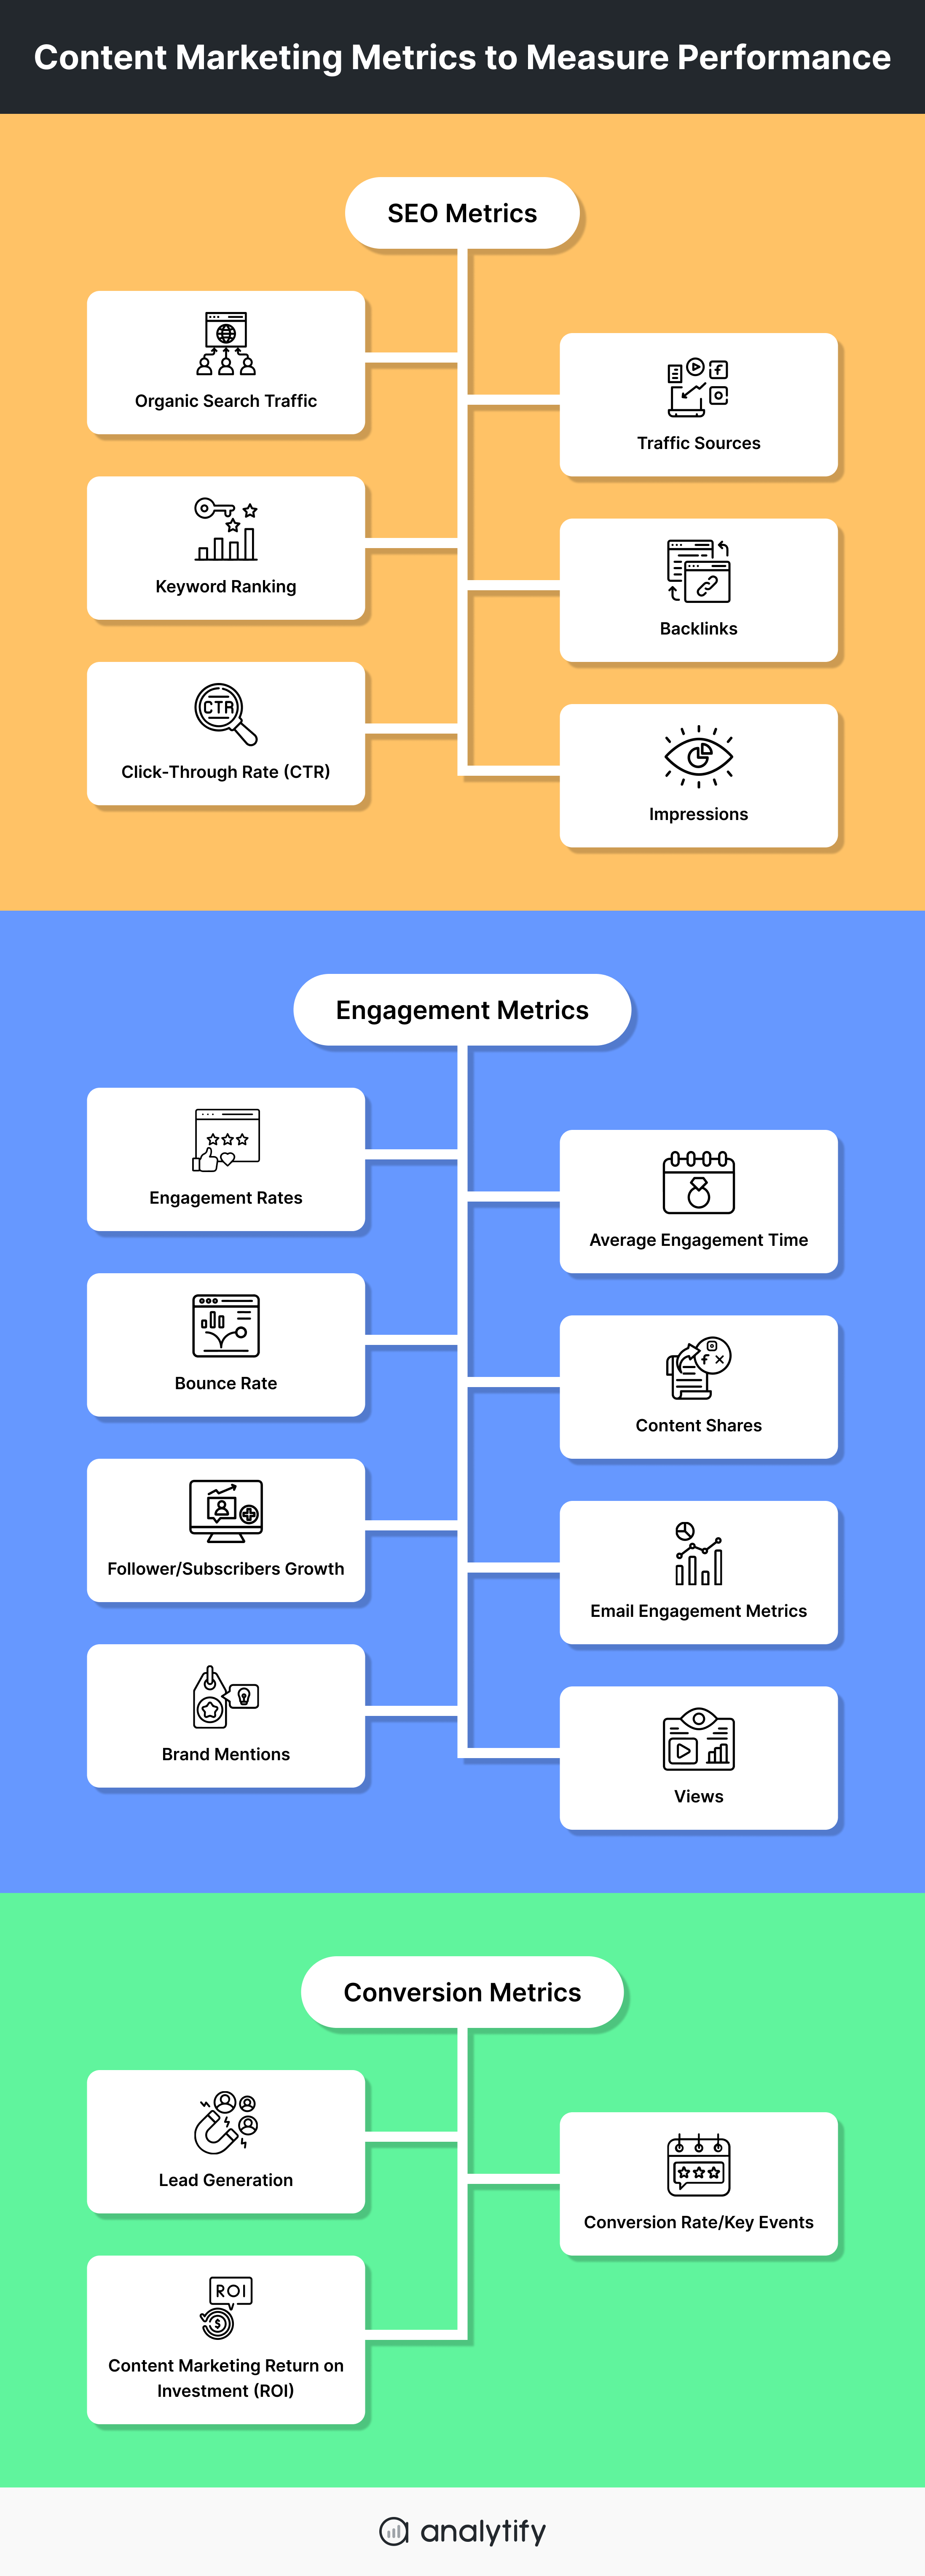

Mastering Content Marketing: Essential Metrics for Unlocking Growth
Content marketing ROI is directly tied to precise measurement. Without understanding what’s working and what isn’t, allocating resources becomes a guessing game. This article details the critical content marketing metrics you must track to drive measurable business results, from audience engagement and lead generation to brand authority and ultimate conversion.
Website Traffic and Engagement Metrics
These foundational metrics offer insight into how users are discovering and interacting with your content on your owned platforms.
-
Unique Visitors: This metric tracks the number of distinct individuals who visit your website within a given timeframe. High unique visitor numbers indicate successful content promotion and a growing audience. Analyzing the sources of these visitors (organic search, social media, direct, referral) reveals which channels are most effective for driving traffic. A steady increase signifies brand awareness and successful outreach.
-
Pageviews: Pageviews represent the total number of times any page on your website has been viewed. While not as nuanced as unique visitors, a high volume of pageviews suggests that users are exploring your site beyond the initial landing page, indicating engaging content and effective internal linking. Correlating pageviews with specific content pieces helps identify popular topics.
-
Average Session Duration: This metric measures the average amount of time a user spends on your website during a single visit. A longer average session duration suggests that visitors are finding your content valuable and are actively consuming it. Conversely, a short duration might signal that users are not finding what they expected or that the content is not holding their attention. Break this down by content type to understand what resonates.
-
Bounce Rate: Bounce rate signifies the percentage of visitors who leave your website after viewing only one page. A high bounce rate on a specific piece of content could indicate that the content is not relevant to the user’s search intent, the page loads too slowly, or the user experience is poor. Analyzing bounce rates by content and traffic source is crucial for identifying and rectifying issues. Lowering bounce rates generally improves user experience and can positively impact search engine rankings.
-
Pages per Session: This metric indicates the average number of pages a user views during a single session. A higher number suggests that users are navigating your site effectively and discovering more of your content. This is a good indicator of content discoverability and user journey engagement. It can also highlight the effectiveness of your calls-to-action (CTAs) in guiding users deeper into your site.
-
Top Performing Pages: Identifying your most popular content by traffic and engagement allows you to understand what topics and formats resonate most with your audience. This data informs future content creation, ensuring you’re producing more of what your audience loves and is likely to engage with.
SEO and Search Performance Metrics
These metrics measure your content’s visibility and effectiveness in search engine results pages (SERPs).
-
Keyword Rankings: Tracking your target keyword rankings in search engines like Google is fundamental. Improved rankings for relevant keywords signal that your content is being recognized by search engines as authoritative and valuable for specific search queries. Monitor rankings for both head terms and long-tail keywords to understand your broader search presence.
-
Organic Traffic: This is the traffic that arrives at your website from unpaid search engine results. Growth in organic traffic is a direct indicator of successful SEO efforts and high-quality, discoverable content. Analyze the content pieces driving this traffic to replicate successful strategies.
-
Search Engine Impressions: Impressions represent how many times your content has appeared in search results. An increase in impressions suggests that your content is being indexed by search engines for more queries, indicating improved SEO and broader visibility.
-
Search Engine Clicks: This metric measures how many users actually clicked on your content from search results. The click-through rate (CTR) – calculated as clicks divided by impressions – is a key indicator of how compelling your title tags and meta descriptions are and how well your content aligns with search intent.
-
Backlinks: Backlinks are links from other websites to yours. High-quality backlinks are a strong signal of authority and trustworthiness to search engines, significantly impacting your SEO performance. Track the number and quality of backlinks your content attracts. Tools like Ahrefs and SEMrush provide valuable backlink data.
-
Domain Authority (DA) / Page Authority (PA): While not direct Google metrics, DA (Moz) and PA (Moz) are useful indicators of your website’s and individual pages’ potential to rank. Consistent growth in these scores suggests that your content is building credibility and authority within your niche.
Lead Generation and Conversion Metrics
These metrics are crucial for demonstrating the direct business impact of your content marketing efforts.
-
Leads Generated: This is the number of new prospects acquired through your content marketing activities. This can include form submissions, demo requests, gated content downloads, or newsletter sign-ups. Segmenting leads by content source or campaign provides insight into which content is most effective for lead acquisition.
-
Conversion Rate: This metric measures the percentage of visitors who complete a desired action (e.g., become a lead, make a purchase) after interacting with your content. A high conversion rate indicates that your content is not only attracting attention but also persuading users to take the next step.
-
Cost Per Lead (CPL): If you’re investing in paid promotion for your content, CPL helps you understand the efficiency of your lead generation efforts. It’s calculated by dividing the total cost of a campaign by the number of leads generated. Lowering CPL indicates more efficient spending.
-
Marketing Qualified Leads (MQLs): MQLs are leads who have demonstrated interest in your product or service through their interactions with your marketing efforts. Tracking how many MQLs your content generates indicates its effectiveness in nurturing prospects further down the funnel.
-
Sales Qualified Leads (SQLs): SQLs are MQLs who have been vetted by the sales team and are considered ready for direct sales engagement. The number of SQLs generated by your content is a direct measure of its contribution to the sales pipeline.
-
Customer Acquisition Cost (CAC): While broader than just content marketing, tracking CAC in relation to content spend helps assess the overall efficiency of your marketing efforts in acquiring paying customers. Content that consistently drives high-quality leads and conversions will contribute to a lower CAC.
-
Attribution Modeling: Understanding which content pieces contribute to conversions is vital. Attribution models (first-touch, last-touch, linear, time-decay) help assign credit to different touchpoints in the customer journey, revealing the true impact of your content marketing on sales.
Brand Awareness and Authority Metrics
These metrics measure the impact of your content on building your brand’s reputation and establishing thought leadership.
-
Social Shares and Engagement: While often considered vanity metrics, social shares, likes, and comments on content can indicate audience resonance and brand visibility. High engagement suggests your content is sparking conversations and being amplified by your audience.
-
Brand Mentions: Tracking mentions of your brand across social media, news outlets, and blogs provides insight into your brand’s visibility and how people are talking about you. Positive mentions, especially those linked to your content, indicate growing brand authority.
-
Direct Traffic: An increase in direct traffic can signify that users are actively seeking out your brand and content, suggesting growing brand recognition and recall. They know your brand name and type it directly into their browser.
-
Referral Traffic from Authoritative Sites: When high-authority websites link to your content, it boosts your credibility and signals to search engines that your content is valuable. Monitor traffic from these high-tier domains.
-
Time Spent on Brand-Related Pages: If you have dedicated "About Us" or "Company" pages, tracking the time users spend on these pages can indicate a deeper interest in your brand beyond specific content pieces.
-
Guest Post Performance: If you’re publishing guest posts on other sites, track the traffic, leads, and backlinks generated from these efforts. This demonstrates your ability to extend your brand’s reach and authority into new audiences.
-
Survey Data and Brand Sentiment: Periodic surveys can gauge brand awareness, perception, and sentiment among your target audience. Correlating changes in these metrics with your content marketing initiatives can highlight their impact on brand perception.
Content Consumption and Performance Metrics
These metrics provide granular insight into how individual pieces of content are performing.
-
Top Performing Content by Engagement: Beyond just traffic, identify content that keeps users on the page longer, generates more comments, or leads to more social shares. This helps understand what truly captivates your audience.
-
Content Download Numbers: For gated content like ebooks, whitepapers, or reports, tracking download numbers is a direct measure of lead generation and content value.
-
Video Views and Watch Time: For video content, monitor view counts, average watch duration, and completion rates. This indicates how engaging and effective your video content is.
-
Webinar Attendance and Engagement: For live or on-demand webinars, track registration numbers, attendee count, and engagement during the session (e.g., Q&A participation, poll responses).
-
Time to First Byte (TTFB) and Page Load Speed: While technical, these metrics are crucial for content performance. Slow-loading pages deter users and negatively impact SEO, directly affecting content consumption.
-
Content Scorecards: Develop internal scorecards that consolidate key metrics for each significant piece of content. This allows for easy comparison and identification of trends.
Integrating and Analyzing Metrics
Simply tracking metrics is insufficient; analysis and integration are key.
-
Establish Clear Goals: Define what success looks like for your content marketing. Are you aiming for brand awareness, lead generation, or direct sales? Your goals will dictate which metrics are most important.
-
Utilize Analytics Tools: Leverage tools like Google Analytics, Google Search Console, marketing automation platforms (e.g., HubSpot, Marketo), CRM systems, and social media analytics dashboards to gather comprehensive data.
-
Segment Your Data: Don’t look at aggregate data alone. Segment your metrics by audience segment, traffic source, content type, campaign, and time period to uncover deeper insights.
-
Correlate Metrics: Look for relationships between different metrics. For instance, does an increase in organic traffic for a specific blog post lead to a higher number of MQLs?
-
Regular Reporting and Review: Establish a consistent reporting cadence (weekly, monthly, quarterly) to review performance, identify trends, and make data-driven adjustments to your content strategy.
-
A/B Testing: Continuously test different headlines, CTAs, content formats, and promotion strategies to optimize performance based on the metrics you’re tracking.
-
Focus on Actionable Insights: The ultimate goal is to translate data into actionable strategies. If a particular content format is underperforming, analyze why and adjust. If a lead generation channel is highly effective, double down on it.
By diligently tracking and analyzing these content marketing metrics, you can move beyond guesswork, optimize your efforts, and demonstrably prove the value of your content marketing initiatives to your organization. This data-driven approach is the cornerstone of sustainable growth and achieving your business objectives.


