Website Audit Google Analytics

Website Audit with Google Analytics: A Comprehensive SEO Strategy
A thorough website audit powered by Google Analytics is not merely a diagnostic exercise; it’s the bedrock of a robust Search Engine Optimization (SEO) strategy. Understanding how users interact with your website, identifying traffic sources, and pinpointing areas of friction are critical for improving search engine rankings and driving qualified leads. This audit process leverages Google Analytics’ extensive data to inform technical SEO, content strategy, user experience enhancements, and ultimately, conversion rate optimization. The core objective is to translate raw data into actionable insights, allowing for data-driven decisions that directly impact your website’s visibility and performance in search engine results pages (SERPs). By systematically dissecting key metrics, you can uncover hidden opportunities and address critical weaknesses that are likely hindering your organic traffic growth and overall business objectives. This comprehensive approach moves beyond superficial checks and delves into the granular details of user behavior, technical soundness, and content effectiveness as interpreted through the lens of Google Analytics.
Key Performance Indicators (KPIs) for Google Analytics Website Audit
The foundation of any effective website audit using Google Analytics lies in the meticulous examination of specific Key Performance Indicators (KPIs). These metrics provide a quantifiable measure of your website’s health and performance, acting as signposts for areas requiring attention.
- Organic Traffic: This is perhaps the most crucial KPI for an SEO-focused audit. Analyze the trends in organic traffic over time (weekly, monthly, quarterly, annually). Significant dips or plateaus warrant immediate investigation. Look for the percentage of total traffic that is organic. A low percentage suggests an over-reliance on paid channels or a deficiency in SEO efforts. Further drill down into landing pages receiving organic traffic. Are these the pages you expect to rank for your target keywords? Are there underperforming pages with high potential?
- Bounce Rate: A high bounce rate across your website or on specific landing pages indicates that users are leaving your site after viewing only one page. While a certain bounce rate is normal, exceptionally high rates (above 60-70% for many industries) suggest issues with content relevance, user experience, site speed, or technical errors. Segment bounce rates by traffic source, device, and landing page to pinpoint the root causes. For instance, a high bounce rate on mobile traffic might point to a poor mobile experience.
- Average Session Duration/Time on Page: This metric indicates how long users are spending on your website or individual pages. Longer durations generally signify engaged users who find your content valuable and relevant. Low session durations could indicate that content is not meeting user expectations, is difficult to navigate, or that users are quickly finding the information they need and leaving (which isn’t always negative, but needs context). Analyze this in conjunction with bounce rate and conversion rates.
- Pages Per Session: This metric measures the average number of pages a user views during a single session. A higher number generally suggests that users are exploring your website and finding multiple points of interest, indicating good internal linking and content structure. Conversely, a low number might suggest a lack of compelling related content or confusing navigation.
- Conversion Rate: This is the ultimate measure of your website’s effectiveness in achieving business goals. This could be a sale, a lead form submission, a newsletter signup, or any other predefined goal. Analyze your overall conversion rate and segment it by traffic source, landing page, device, and user demographics. Identify which channels and pages are driving the most valuable actions and which are underperforming. Low conversion rates on high-traffic pages are a critical red flag.
- New vs. Returning Visitors: Understanding the ratio of new to returning visitors provides insights into your ability to attract new audiences and retain existing ones. A healthy website typically has a balance. A significant increase in new visitors without a corresponding increase in returning visitors might suggest issues with engagement or retention. Conversely, a dominance of returning visitors with stagnant new visitor numbers could indicate limited reach.
Technical SEO Audit with Google Analytics Insights
While Google Analytics is primarily a behavioral analytics tool, its data can indirectly inform critical technical SEO audits, helping identify issues that impact crawlability, indexability, and user experience.
- Site Speed and Performance: Google Analytics’ "Site Speed" report (though largely deprecated in favor of Google Search Console and dedicated speed tools) historically provided insights into page load times. Even without this direct report, you can infer performance issues by correlating high bounce rates and low average session durations with specific landing pages. High bounce rates on pages with seemingly relevant content often point to slow loading times. You can also export data to spreadsheets and cross-reference it with speed testing tools like Google PageSpeed Insights and GTmetrix. Slow pages frustrate users and are penalized by search engines.
- Mobile Usability: Analyze the "Mobile Overview" or segment traffic by "Mobile" devices in the Audience reports. Examine bounce rates, session durations, and conversion rates for mobile users. If these metrics are significantly worse for mobile than for desktop, it’s a strong indicator of poor mobile usability, responsive design issues, or mobile-specific technical problems. Google prioritizes mobile-first indexing, making mobile performance paramount.
- Crawl Errors (Indirect Insights): While Google Analytics doesn’t directly report crawl errors, you can identify pages that are receiving no traffic or significantly declining traffic that should be performing well. These pages might be encountering indexing issues or broken links. Cross-reference this with Google Search Console’s "Coverage" report. Pages listed as "Excluded" or with errors in Search Console that you expect to rank can be further investigated using Analytics data to understand if users are attempting to reach them.
- Broken Links and Redirect Chains (Indirect Insights): High bounce rates on specific pages can sometimes be a symptom of users landing on a 404 error page or encountering a broken internal link. Similarly, prolonged session durations followed by a sudden drop might indicate a user navigating through multiple redirects. While Analytics doesn’t explicitly show these, they are often underlying causes of poor user experience data. The "Behavior Flow" report can sometimes highlight unexpected navigation paths that might hint at redirect issues or usability problems.
- JavaScript Rendering Issues: If large portions of your content are dynamically loaded via JavaScript, and you see significantly lower organic traffic to those pages compared to similar static content pages, it could indicate that search engine bots are struggling to render and index your JavaScript. While Analytics won’t directly diagnose this, it provides the behavioral data to flag pages for deeper technical inspection.
Content Audit and Strategy Refinement with Google Analytics
Content is king in SEO, and Google Analytics is an indispensable tool for assessing content performance and informing future content strategies.
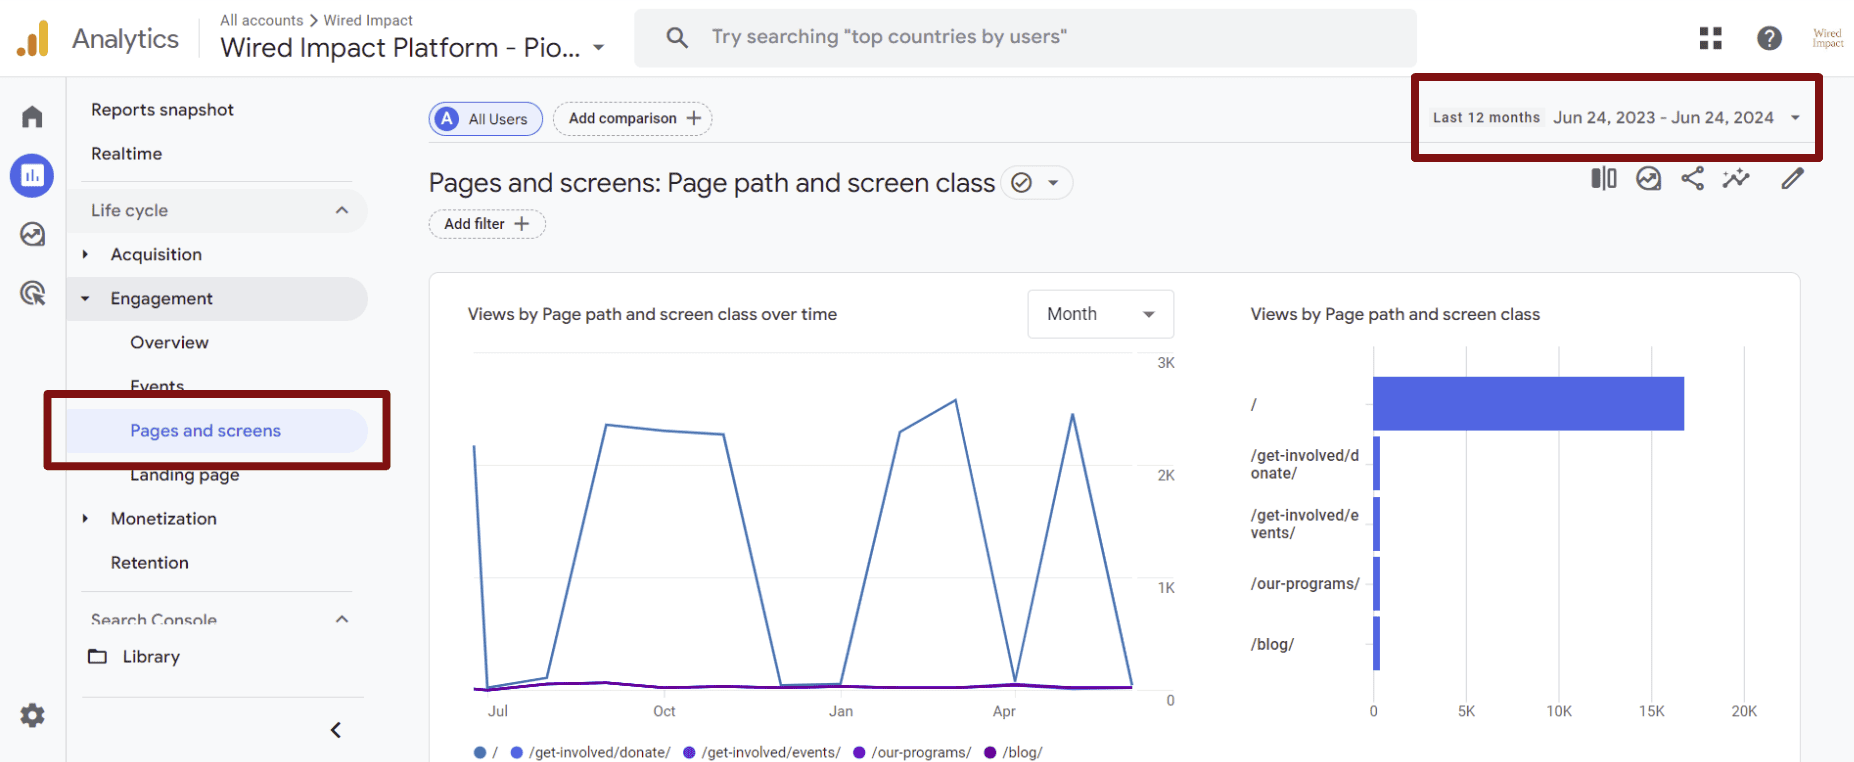
- Top Performing Content: Identify your highest-traffic landing pages via the "All Pages" report under Behavior. Analyze which blog posts, product pages, or service pages are attracting the most organic visitors. Examine their associated metrics: bounce rate, average time on page, and conversion rate. High traffic with low engagement or conversions indicates a disconnect between content and user intent.
- Underperforming Content: Conversely, identify pages that are receiving minimal organic traffic but are relevant to your core keywords or business offerings. These might be candidates for content optimization, updating, or promotion. Analyze why they might be underperforming – is it poor on-page SEO, lack of internal linking, or simply a lack of visibility?
- Content Gap Analysis (Indirect): By analyzing user search queries in Google Search Console and observing the landing pages that users eventually arrive at via organic search, you can identify content gaps. If users are frequently searching for a term and landing on a tangential page, it signifies an opportunity to create more specific, targeted content. While Analytics doesn’t show search queries directly, observing the journey of users who arrive organically can hint at what they were looking for.
- User Engagement with Content: Beyond simple page views, delve into metrics like "Average Time on Page" and "Scroll Depth" (if implemented with custom tracking) for individual content pieces. This helps understand if users are actually consuming the content or just skimming. High scroll depth combined with low time on page might indicate that users are finding what they need quickly, or that the content is not engaging enough to hold their attention.
- Content Format Effectiveness: Analyze which content formats (blog posts, videos, infographics, landing pages) are performing best in terms of traffic, engagement, and conversions. This can guide your content creation efforts, emphasizing formats that resonate most with your audience and drive desired outcomes.
- Keyword Performance: While Google Analytics’ "Organic Keywords" report is largely anonymized due to privacy changes, the "Landing Pages" report provides valuable insights. By understanding which landing pages receive the most organic traffic, you can infer which keywords are likely driving that traffic, especially when cross-referenced with Google Search Console. Focus on optimizing these high-performing pages further and identifying opportunities for related keyword targeting.
User Experience (UX) and Conversion Rate Optimization (CRO) with Google Analytics
Google Analytics provides direct insights into user behavior, which is crucial for identifying UX friction points and opportunities for conversion rate optimization.
- User Flow Analysis: The "Behavior Flow" report visualizes the paths users take through your website. Identify common drop-off points in user journeys, particularly before a conversion event. Understanding these bottlenecks is key to streamlining navigation and improving the user experience. Are users abandoning a process midway through a checkout funnel? Are they getting lost navigating between related product pages?
- Goal Funnel Visualization: If you have set up goal funnels (e.g., for a multi-step checkout process or lead generation form), this report is invaluable. It shows where users are dropping out of the funnel, allowing you to pinpoint specific pages or steps that are causing friction. Optimizing these specific points can significantly improve conversion rates.
- Exit Pages: Identify the pages from which users most frequently leave your website. While some exits are natural, a high exit rate on key pages within a conversion funnel or on otherwise important pages can indicate a problem. It might be a lack of clear calls to action, missing information, or a poor user experience.
- Device Performance: As mentioned earlier, comparing performance metrics across different devices (desktop, mobile, tablet) is crucial for UX. A poor mobile experience can significantly hinder conversions. Ensure your website is fully responsive and optimized for all devices.
- Audience Segmentation: Utilize Google Analytics’ segmentation capabilities to understand how different user groups interact with your website. Segment by demographics, interests, acquisition channels, and behavior. This allows you to tailor content and calls to action to specific audiences, improving relevance and driving conversions. For example, you might find that a particular product page converts much better for a specific age group, allowing you to create targeted marketing campaigns.
- A/B Testing Insights: While Google Analytics doesn’t perform A/B testing itself, it’s the essential tool for analyzing the results of your A/B tests. After running tests on landing pages, calls to action, or website layouts, use Analytics to compare the performance of the different variations in terms of traffic, engagement, and conversion rates. This data-driven approach is fundamental to iterative CRO.
Actionable Steps for Your Google Analytics Website Audit
- Define Your Goals: Before diving into the data, clearly define your website’s primary business objectives (e.g., increase sales by X%, generate Y leads per month, improve brand awareness). Your audit should align with these goals.
- Set Up Goals and Events: Ensure all relevant conversion goals (e.g., form submissions, purchases, downloads) are accurately set up in Google Analytics. Implement event tracking for micro-conversions (e.g., video plays, PDF downloads) that contribute to larger goals.
- Review Google Search Console Integration: Connect Google Analytics with Google Search Console to gain access to crucial SEO data like keyword performance, crawl errors, and indexing status, which are vital for a comprehensive audit.
- Establish Benchmark Metrics: Understand what constitutes good performance for your industry and website. Research industry benchmarks for bounce rate, conversion rate, and session duration.
- Regularly Schedule Audits: A website audit is not a one-time event. Schedule regular audits (monthly, quarterly) to track progress, identify emerging issues, and adapt to changes in user behavior and search engine algorithms.
- Segment Your Data: Don’t rely on aggregate data. Segment your reports by traffic source, device, landing page, user type, and demographics to uncover granular insights.
- Prioritize Findings: Based on your audit, identify the most critical issues that are impacting your KPIs. Prioritize your efforts on the actions that will yield the greatest return.
- Implement and Track: Translate your findings into actionable changes. Implement the recommended SEO, content, and UX improvements. Critically, use Google Analytics to track the impact of these changes over time.
- Iterate and Refine: SEO and website optimization are ongoing processes. Continuously monitor your data, identify new opportunities, and refine your strategies based on what the data tells you.
- Consider Advanced Tracking: For deeper insights, explore implementing custom tracking with Google Tag Manager for advanced event tracking, scroll depth tracking, and form abandonment tracking.
By systematically applying the principles of a Google Analytics-driven website audit, you can transform your online presence from a static entity into a dynamic, high-performing asset that consistently attracts and converts your target audience, ultimately driving sustainable business growth.


