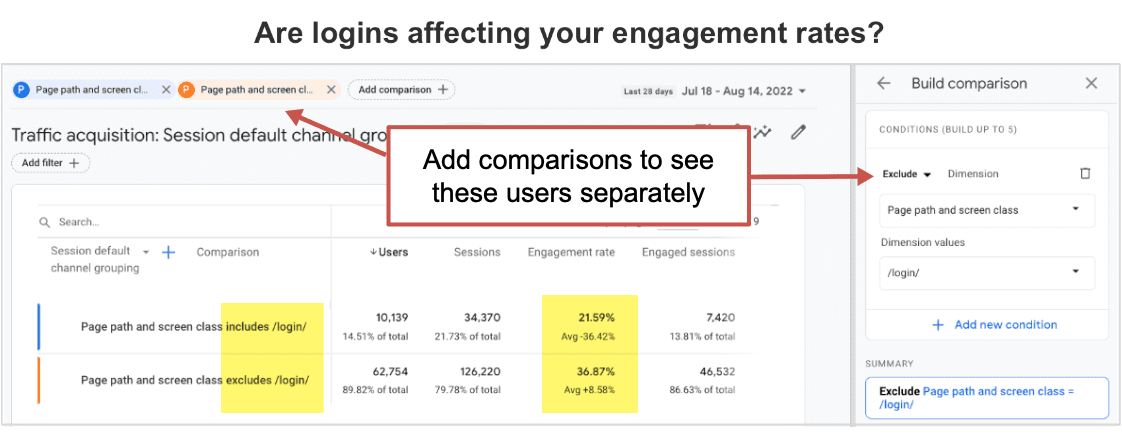
Website engagement rate GA4 is crucial for understanding user behavior. This in-depth guide explores how to leverage GA4 metrics to analyze and boost engagement, moving beyond the limitations of Universal Analytics. We’ll uncover key engagement metrics, factors influencing rates, and actionable strategies to improve your website’s performance.
We’ll delve into defining website engagement in GA4, highlighting the differences from Universal Analytics. Understanding the various engagement actions tracked by GA4 is paramount to interpreting user interactions. This guide will also discuss key engagement metrics in GA4, their calculations, and typical ranges across different industries.
Defining Website Engagement Rate in GA4
Understanding website engagement is crucial for any online business. It’s no longer enough to simply count visitors; we need to know how they interact with our site. Google Analytics 4 (GA4) provides a more comprehensive view of user behavior, allowing us to track engagement in a way that’s more insightful than previous versions. This shift allows for more accurate assessment of user interest and website effectiveness.GA4’s approach to engagement focuses on actions users take on your site.
Instead of relying on sessions and pageviews, it tracks events, providing a more dynamic and nuanced understanding of user journeys. This allows for a more comprehensive understanding of how users interact with your website.
Website Engagement Rate Definition in GA4
Website engagement rate in GA4 is the percentage of users who perform specific engagement actions on your website within a given timeframe. It’s calculated by dividing the number of users who engaged by the total number of users during that period. This measurement is distinct from previous models, offering a more granular and accurate assessment of user interaction.
Key Differences Between Universal Analytics and GA4 Engagement Metrics
Universal Analytics primarily relied on sessions and pageviews to gauge engagement. GA4, on the other hand, tracks events, which offer a wider scope of user interactions, encompassing more nuanced data points. This difference is critical for understanding how users truly interact with your website.
| Metric | Universal Analytics | GA4 |
|---|---|---|
| Sessions | Primary measure of engagement | Replaced by events, but still relevant |
| Pageviews | Key indicator of user interaction | Part of event data; can be a specific event |
| Bounce Rate | Percentage of single-page visits | Calculated using engagement events and engagement rate; more complex |
| Engagement Time | Duration of a session | Captured through event timings, more granular |
| Event Tracking | Limited; mainly for specific actions | Comprehensive; tracks virtually any user action |
Types of Engagement Actions Tracked by GA4
GA4 tracks a vast array of user actions as events. These events encompass various interactions, from simple button clicks to complex interactions like completing a purchase.
- Page Views: A user viewing a specific page on your website.
- Clicks: A user clicking on a button, link, or other interactive element.
- Scroll Depth: How far down a user scrolls on a page.
- Downloads: A user downloading a file (e.g., a document, image).
- Purchases: A user completing a transaction on your site.
- Add to Cart: A user adding an item to their shopping cart.
- Custom Events: Any other action you want to track, like watching a video or starting a form.
The comprehensive nature of event tracking allows for a much deeper understanding of user behavior and preferences.
Importance of Website Engagement Rate in Understanding User Behavior
The engagement rate provides valuable insights into how users interact with your website. High engagement rates suggest users find your content valuable and are actively involved in your site. Conversely, low engagement rates indicate potential issues with your website’s design, content, or user experience. Analyzing engagement patterns helps identify areas for improvement and ultimately increase conversions. The ability to track and measure these factors is essential for optimizing user journeys.
Key Engagement Metrics in GA4
Diving into GA4, understanding website engagement is crucial for optimizing user experience and achieving business goals. The right metrics provide valuable insights into how users interact with your site, enabling data-driven decisions to improve conversion rates and overall performance. This section will explore the key engagement metrics in GA4, their calculation methods, contextual interpretations, and typical industry ranges.
Essential Engagement Metrics
Several key metrics reveal the depth and quality of user engagement. These metrics paint a picture of user behavior, from initial interaction to repeated visits. Understanding these metrics is essential to identifying areas for improvement and tailoring your website strategy accordingly.
Session Duration
Session duration measures the average time a user spends on your website during a single session. This metric is directly correlated with user engagement and website content value. A longer session duration generally indicates a more engaging experience. A shorter duration could point to a need for improved content, navigation, or overall site design.
Calculation: Calculated as the average duration of all sessions on your website.
Typical Range: In e-commerce, sessions lasting 2-5 minutes are common. News websites might have shorter sessions (1-3 minutes), while complex B2B platforms might see longer sessions (5+ minutes).
Bounce Rate
Bounce rate represents the percentage of sessions where users leave your site after viewing only one page. A high bounce rate might suggest issues with the landing page, navigation, or the overall user experience. Low bounce rates suggest the site is successful in capturing user interest and guiding them to other pages.
Calculation: Bounce rate = (Number of sessions with one page view / Total sessions) – 100
Analyzing website engagement rate in GA4 is crucial for understanding user interaction. Recent disturbing news about the former Oakland youth swim coach sentenced to prison for sexually abusing a student, highlights the importance of prioritizing child safety and safeguarding vulnerable populations. This tragic event, reported in this news article , reminds us that beyond website metrics, we must all be vigilant about protecting children.
Fortunately, improving website engagement rate in GA4 can be a proactive way to better understand user behavior and ultimately create safer online spaces.
Typical Range: E-commerce sites often have bounce rates between 40-60%, while blogs or informational sites might see higher rates (60-80%). A low bounce rate (under 40%) often suggests a high-quality user experience.
Pages/Session
Pages per session indicates the average number of pages a user views during a single session. A higher number typically indicates deeper engagement and interest in the content. This metric is useful in determining whether users are exploring different aspects of your site.
Calculation: Pages/Session = Total page views / Total sessions
Typical Range: E-commerce websites often see 2-4 pages per session. Blogs or informational sites might see higher or lower values depending on the specific content and design.
GA4 website engagement rates are fascinating, but sometimes, like when someone tells a bad joke, they can fall flat. For example, a recent article on Miss Manners’ take on inappropriate humor miss manners cant stand their jokes highlights the importance of considering your audience. Ultimately, understanding user engagement is key to optimizing website performance, just like knowing how to respond to a joke is key to a successful conversation.
Engagement Rate
Engagement rate measures the level of interaction users have with your site’s content. This metric is often calculated by summing various engagement actions like clicks, scrolls, or video plays. A high engagement rate suggests users are actively engaging with your website’s content.
Calculation: A precise formula varies based on the specific actions you want to measure. For example, you might track the number of clicks on internal links, video plays, or scrolls on a page and calculate the ratio to total sessions.
Typical Range: The range for engagement rate is highly dependent on the website’s content, industry, and target audience. It is crucial to benchmark against similar sites.
Engagement Metrics Summary
| Metric | Formula | Explanation | Typical Range (Examples) |
|---|---|---|---|
| Session Duration | Average session duration | Average time spent on the site per session. | E-commerce (2-5 minutes), News (1-3 minutes), B2B (5+ minutes) |
| Bounce Rate | (Sessions with one page view / Total sessions) – 100 | Percentage of sessions where users leave after viewing one page. | E-commerce (40-60%), Blogs (60-80%) |
| Pages/Session | Total page views / Total sessions | Average number of pages viewed per session. | E-commerce (2-4 pages), Blogs (variable) |
| Engagement Rate | (Sum of engagement actions / Total sessions) | Level of interaction with content. | Dependent on website content, industry, and target audience. |
Factors Influencing Website Engagement Rate: Website Engagement Rate Ga4
Website engagement rate in Google Analytics 4 (GA4) is a crucial metric for understanding how users interact with your site. A high engagement rate indicates that users are actively exploring and interacting with your content, leading to higher conversions and a more valuable user experience. Understanding the factors that drive this engagement is key to optimizing your website for maximum effectiveness.Website engagement isn’t just about attracting visitors; it’s about keeping them engaged and encouraging them to return.
This requires a multifaceted approach that considers various elements. From the design of the user interface to the quality of your content and the overall performance of the site, several key factors play a significant role in driving engagement. Understanding these factors allows you to make informed decisions about website improvements and maximize your GA4 engagement metrics.
User Experience (UX) Design Impact on Engagement
Effective UX design is paramount for high engagement rates. A well-designed website is intuitive and easy to navigate, minimizing user frustration and maximizing user satisfaction. Clear navigation, logical site structure, and visually appealing layouts contribute significantly to a positive user experience. Consistent branding and a seamless transition between pages also enhance the overall user journey. Poor UX design, on the other hand, can lead to high bounce rates and low engagement.
Tracking website engagement rate in GA4 is crucial, but it’s also fascinating to see how engagement translates to real-world impact. For example, the recent Bay Area news group’s coverage of the boys athlete of the week, encompassing CIF NorCal basketball and soccer, highlights the impact of sports news on online engagement. bay area news group boys athlete of the week cif norcal basketball soccer mercury news This sort of local news can significantly boost website traffic, which, in turn, helps us understand and optimize our GA4 metrics for better engagement.
Content Quality and Relevance in Engagement
High-quality, relevant content is the cornerstone of effective website engagement. Users spend more time on websites that offer valuable information, interesting articles, or engaging multimedia. This content should align with user needs and interests, providing solutions or satisfying their curiosity. Poorly written, outdated, or irrelevant content will deter users, leading to low engagement and increased bounce rates.
For instance, if a user searches for “how to bake a cake,” a website providing a detailed and well-illustrated recipe will likely be more engaging than one with a vague and poorly formatted description.
Website Speed and Performance Affecting Engagement
Website speed is a critical factor influencing engagement. Slow-loading pages frustrate users and lead to higher bounce rates. A website that takes too long to load can quickly lose visitors who prefer faster alternatives. Optimizing images, leveraging caching mechanisms, and utilizing a robust hosting infrastructure are crucial for ensuring optimal performance. A faster website results in increased user satisfaction and higher engagement metrics.
Mobile-Friendliness and Accessibility for Engagement
In today’s mobile-first world, mobile-friendliness is no longer a luxury but a necessity. A website that adapts seamlessly to different screen sizes and devices ensures a positive experience for all users. Accessibility features, such as alt text for images and keyboard navigation, are also important for ensuring inclusivity and reaching a wider audience. Failing to consider mobile-friendliness and accessibility can lead to a significant loss of potential users and a decline in engagement rates.
Factors Influencing Website Engagement Rate – Summary Table
| Factor | Impact on Engagement Rate |
|---|---|
| User Experience (UX) Design | Intuitive navigation and clear structure lead to higher engagement; poor design leads to frustration and low engagement. |
| Content Quality and Relevance | High-quality, relevant content keeps users engaged; poor or irrelevant content drives users away. |
| Website Speed and Performance | Fast loading speeds enhance user experience and engagement; slow loading times result in higher bounce rates. |
| Mobile-Friendliness and Accessibility | Responsive design and accessibility features cater to a broader audience, improving engagement. |
Analyzing Engagement Rate Trends
Tracking website engagement isn’t just about knowing the current numbers; it’s about understanding how those numbers change over time. Analyzing trends in engagement reveals patterns, identifies seasonal variations, and helps pinpoint areas for improvement. This deeper understanding empowers data-driven decisions that optimize user experience and maximize website ROI.Understanding engagement rate trends is crucial for proactive website management. By identifying patterns and anomalies, you can anticipate user behavior and adjust strategies accordingly.
This proactive approach can lead to increased user engagement, improved conversion rates, and a more successful online presence.
Tracking Engagement Rate Trends Over Time
Analyzing engagement rate trends over time involves consistently monitoring key metrics within a specific timeframe. This requires establishing a baseline and regularly comparing subsequent data points. Using tools like Google Analytics 4 (GA4), you can set up custom reports that track engagement rate over specific periods, like weekly or monthly. This data allows you to identify positive or negative trends and make informed decisions.
Tools like GA4 offer flexible reporting options that allow for custom date ranges and comparisons.
Identifying Seasonal Variations in Engagement
Recognizing seasonal fluctuations in engagement is vital for strategic planning. Certain holidays, events, or changes in user behavior often influence engagement levels. For example, e-commerce sites typically see a surge in engagement leading up to major holidays like Christmas. GA4 allows for the comparison of engagement metrics during different time periods to highlight these seasonal trends. Understanding these patterns enables you to tailor marketing strategies and content to align with user behavior during different seasons.
Comparing Engagement Across Different User Segments
GA4 allows you to segment users based on various criteria, such as demographics, location, or device type. Comparing engagement rates across these segments provides valuable insights into user preferences. For instance, you might find that mobile users spend significantly less time on specific pages compared to desktop users. This analysis allows you to tailor the website experience to specific user segments, leading to optimized engagement.
This analysis helps to understand user behavior differences across various demographics and device types.
Identifying Key Areas for Improvement Based on Trends
Analyzing engagement trends reveals areas requiring attention. A decline in engagement might indicate a problem with website design, content, or user experience. By tracking trends, you can pinpoint specific issues and implement improvements. For example, if bounce rates increase during specific hours, it suggests a potential problem with the website’s performance or content relevance during those hours.
Regular trend analysis provides actionable insights to identify problem areas and implement solutions.
Creating a Visual Representation of Engagement Trends
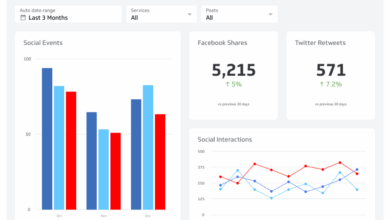
Visualizing engagement trends using GA4 data is essential for effective communication and analysis. Charts and graphs clearly illustrate patterns and variations over time. Line charts, for example, effectively depict engagement rate fluctuations. A simple line chart showcasing the monthly engagement rate for the past year allows for easy identification of trends, peaks, and troughs. Visual representations enable a quick grasp of data insights and facilitate the communication of trends to stakeholders.
Improving Website Engagement Rate
Boosting website engagement isn’t just about pretty visuals; it’s about creating a seamless experience that keeps visitors coming back for more. Understanding what truly captivates users is key to achieving higher engagement rates, ultimately leading to more conversions and a stronger online presence. This involves a multi-faceted approach that goes beyond simple aesthetics and delves into content strategy, user experience, and personalization.
Content Optimization Strategies
Effective content is the cornerstone of a successful website. It needs to be engaging, informative, and relevant to your target audience. High-quality content that resonates with your audience keeps them coming back for more. This involves more than just s. Think about the value you’re providing.
Are you answering questions? Solving problems? Providing unique insights? By focusing on delivering value, you naturally attract and retain visitors.
- Research and Integration: Identifying the right s relevant to your content is crucial for attracting the right audience. These s should be strategically integrated into titles, headings, and body text. This enhances discoverability while keeping the language natural and engaging.
- Compelling Headlines and Subheadings: The first impression is crucial. Captivating headlines and subheadings draw readers in and encourage them to delve deeper into the content. Think about using numbers, questions, or intriguing statements to pique curiosity.
- Visually Appealing Formatting: Using visuals like images, videos, and infographics can significantly enhance engagement. These visuals should be relevant, high-quality, and optimized for fast loading times.
Clear Calls to Action (CTAs)
Clear and compelling calls to action (CTAs) are essential for guiding users towards desired actions. Without clear CTAs, website visitors may not know what you want them to do next. Well-placed and designed CTAs can significantly influence engagement and conversions.
- Strategic Placement: Placement of CTAs is vital. They should be visible, easily accessible, and contextually relevant. Consider placing them at natural stopping points within the content or after presenting valuable information.
- Action-Oriented Language: Use language that encourages immediate action. Instead of “Learn More,” try “Download Now” or “Sign Up Today.” This prompts visitors to take the next step.
- Visual Design: Make CTAs visually distinct. Use contrasting colors and fonts to make them stand out and easily noticeable. Ensure that the design elements are aligned with your overall brand identity.
User Experience (UX) and Design
A positive user experience (UX) is paramount for keeping visitors engaged. A website that is intuitive, easy to navigate, and visually appealing will keep visitors coming back. UX encompasses all aspects of the user’s interaction with the site.
- Intuitive Navigation: Users should be able to easily find what they’re looking for. A clear site structure, intuitive menus, and a well-organized layout are essential for this. Users should be able to easily access the most important information and features.
- Mobile Responsiveness: Websites should adapt seamlessly to different devices and screen sizes. Mobile-friendliness is no longer an option; it’s a necessity. A website that works perfectly on all devices ensures a consistent and positive experience for every visitor.
- Fast Loading Speed: Slow loading times are a major turnoff. Optimize images, minimize code, and use a fast hosting provider to ensure your site loads quickly. A faster site directly contributes to a better user experience.
Personalization Strategies
Personalization can significantly enhance engagement. By tailoring the user experience to individual preferences, you can create a more relevant and engaging experience.
- Content Recommendations: Based on past behavior, suggest relevant content to users. This can include articles, products, or services that align with their interests.
- Targeted Promotions: Offer personalized discounts or promotions based on user preferences and browsing history. This can incentivize repeat visits and purchases.
- Customized Experiences: Use data to tailor the website experience to individual needs. For example, if a user is looking for a specific product, display related information prominently.
Actionable Strategies for Improving Engagement
| Strategy | Action Items | Expected Outcome |
|---|---|---|
| Optimize Content | research, compelling headlines, visually appealing formatting | Increased user engagement, improved search rankings |
| Enhance CTAs | Strategic placement, action-oriented language, visually distinct design | Higher click-through rates, improved conversion rates |
| Improve UX/Design | Intuitive navigation, mobile responsiveness, fast loading speed | Enhanced user satisfaction, reduced bounce rates |
| Implement Personalization | Content recommendations, targeted promotions, customized experiences | Increased user engagement, improved customer loyalty |
Case Studies of High Engagement Websites
Unveiling the secrets behind exceptional website engagement requires a deep dive into the strategies employed by industry leaders. High engagement websites aren’t just about pretty designs; they’re meticulously crafted experiences that keep visitors coming back for more. Understanding their approaches provides valuable insights for boosting engagement on any site.High engagement isn’t a one-size-fits-all phenomenon. Different industries and user bases demand unique strategies.
Examining successful case studies reveals the diverse tactics used to foster a loyal audience and measurable engagement. This exploration provides concrete examples and actionable insights that can be applied to your own website.
Examples of High Engagement Websites
Numerous websites excel in user engagement. These include e-commerce platforms like Amazon, social media giants like Facebook, and content platforms like YouTube. Each demonstrates unique approaches to capturing and maintaining user interest.
Strategies Employed by High Engagement Websites
Understanding the strategies behind high engagement requires a nuanced approach. These websites often implement a combination of factors, including personalized content recommendations, interactive elements, and clear navigation. The core principles include:
- Personalized Experiences: Recognizing individual user preferences and tailoring content accordingly is a crucial aspect. For example, Amazon’s recommendations based on past purchases or browsing history directly address this. The more a website can cater to individual needs, the higher the engagement.
- Interactive Elements: Games, quizzes, polls, and interactive maps enhance user experience. The active participation fosters deeper engagement. These interactive elements provide entertainment, knowledge, or both.
- Clear Navigation: Intuitive and easy-to-understand navigation is critical. A website that is easy to explore encourages longer sessions and increased interaction.
Key Features Contributing to High Engagement
Beyond strategies, specific features contribute significantly. These websites leverage features such as:
- High-Quality Content: Informative, engaging, and relevant content is essential. This could be in the form of articles, videos, or other media formats. Content quality is a cornerstone of high engagement.
- Mobile Friendliness: With mobile use dominating, websites must be accessible and responsive on various devices. This ensures a seamless experience regardless of the platform.
- Fast Loading Speed: Users have short attention spans. Slow loading times lead to frustration and reduced engagement. Optimizing website speed is critical.
Specific Actions Taken by High Engagement Websites
Beyond general strategies, specific actions drive engagement. For instance:
- Community Building: Encouraging user interaction and fostering a sense of community is vital. This could involve forums, comments sections, or social media integration.
- Incentivizing Engagement: Rewards, points systems, or exclusive content can motivate users to engage more deeply. Loyalty programs, discounts, and other incentives play a vital role.
- A/B Testing: Continuously testing and refining different design elements and content based on user responses is essential. Data analysis helps determine what resonates with the target audience.
Comparison of Engagement Strategies
| Website | Personalized Recommendations | Interactive Elements | Clear Navigation | High-Quality Content | Mobile Friendliness |
|---|---|---|---|---|---|
| Amazon | High | Moderate | High | High | High |
| High | High | Moderate | Moderate | High | |
| YouTube | Moderate | Low | High | High | High |
Tools and Resources for GA4 Engagement Analysis
Beyond the core GA4 platform, leveraging external tools and resources can significantly enhance your understanding of website engagement. This approach allows for deeper dives into specific metrics and patterns, ultimately leading to more effective strategies for improving engagement. A comprehensive toolkit is crucial for actionable insights.
Beyond the GA4 Dashboard: External Tools
GA4 provides a strong foundation for website engagement analysis, but external tools offer powerful extensions to this base. Utilizing these complementary tools allows for more granular exploration of user behavior and data visualization. This in-depth analysis often reveals insights that would be missed using GA4 alone.
Data Visualization Tools for Deeper Insights
Visualizing engagement data is key to understanding trends and patterns. Tools like Tableau, Power BI, and Google Data Studio transform raw GA4 data into compelling charts and graphs. These tools facilitate identification of key engagement drivers and areas needing improvement. For instance, visualizing bounce rate trends alongside specific content performance can uncover correlations between content quality and user engagement.
A well-designed visualization can highlight user journeys and pain points within a website, enabling targeted improvements.
Complementary External Tools
External tools offer valuable context beyond GA4’s core functionality. For instance, heatmaps and session recordings from tools like Hotjar provide visual representations of user interactions on the website. This qualitative data enriches quantitative GA4 metrics by illustratinghow* users are interacting with the site, revealing usability issues or areas of high interest. Integrating these tools with GA4 data offers a more comprehensive view of the user experience.
This combined approach is crucial for understanding why certain engagement metrics are performing as they are.
Resources for Further Learning, Website engagement rate ga4
Numerous resources are available for deepening your understanding of website engagement analysis using GA4. Online courses, webinars, and blog posts provide practical insights and techniques. Keeping up-to-date with industry best practices and new tools is essential for ongoing improvement. Stay informed about emerging trends and advancements in data analysis to optimize your website strategies.
Summary Table of Tools and Resources
| Category | Tool/Resource | Description |
|---|---|---|
| Data Visualization | Tableau | Powerful data visualization and analysis platform. |
| Power BI | Business intelligence tool for interactive data exploration. | |
| Google Data Studio | Free, user-friendly tool for creating custom dashboards. | |
| User Experience Analysis | Hotjar | Provides heatmaps, session recordings, and user feedback. |
| Crazy Egg | Offers heatmaps, scroll maps, and other user interaction data. | |
| Learning Resources | Online Courses (e.g., Coursera, Udemy) | Structured learning on data analysis and web analytics. |
| Webinars & Blogs | Stay updated on industry trends and best practices. |
Best Practices for Implementing GA4 for Engagement
Unlocking the true potential of your website requires a strategic approach to implementing Google Analytics 4 (GA4). This involves more than just setting up the platform; it’s about establishing a framework that accurately measures and interprets user engagement. A well-structured GA4 implementation provides valuable insights for optimizing website performance and driving meaningful business outcomes.A robust GA4 setup is not just about collecting data; it’s about transforming that data into actionable insights.
Defining clear goals and metrics, segmenting users, and consistently monitoring engagement patterns are crucial steps. By adhering to these best practices, you can ensure GA4 becomes a powerful tool for understanding your audience and enhancing user experience.
Defining Clear Goals and Metrics
Establishing clear goals is fundamental to a successful GA4 implementation. These goals, whether increasing conversions, boosting time on site, or improving bounce rates, must be quantifiable and directly linked to business objectives. Clearly defined metrics provide a framework for measuring progress and evaluating the effectiveness of implemented strategies. Without well-defined goals and metrics, the data collected in GA4 can become overwhelming and lack practical application.
For example, a goal might be to increase the number of product views by 15% within the next quarter, with the associated metrics being product page views and conversion rates.
Segmenting Users for Tailored Analysis
GA4’s segmentation capabilities allow for a granular understanding of user behavior. By segmenting users based on various characteristics (e.g., demographics, acquisition channels, device type), you can gain deeper insights into different user groups. This tailored analysis helps you understand which user segments are most engaged and which are less engaged, enabling targeted interventions to improve engagement across the board.
For instance, identifying users who abandon shopping carts allows you to tailor interventions that improve the checkout process specifically for that segment.
Regular Monitoring and Review of Engagement Metrics
Regularly reviewing engagement metrics is essential to identify trends and adapt strategies accordingly. Engagement metrics should be monitored on a weekly or monthly basis to identify any fluctuations or anomalies in user behavior. Monitoring enables proactive responses to emerging issues and the implementation of timely optimizations. This ongoing process allows for continuous improvement in website performance.
Identifying Key Patterns and Trends
Analyzing engagement patterns reveals valuable insights into user behavior and preferences. By identifying recurring patterns, you can tailor content and offerings to better resonate with your audience. For example, if users from a particular region consistently spend more time on specific product pages, it indicates a potential interest in that product line. Tools like GA4’s interactive dashboards facilitate the identification of such patterns.
Steps for Setting up GA4 for Engagement Analysis
- Define your goals and key engagement metrics. This initial step is critical for establishing a clear direction for your GA4 implementation. Without clear objectives, data analysis will lack focus.
- Set up GA4 property and connect it to your website. Ensure accurate tracking by correctly implementing the tracking code on all relevant pages.
- Configure events and dimensions to capture user interactions. Define specific user interactions, such as page views, clicks, and conversions, as events in GA4.
- Establish user segments based on your key attributes. Create segments to understand different user groups’ behavior and tailor your strategies accordingly.
- Regularly monitor and analyze engagement metrics. Track metrics regularly to identify trends and adapt your strategies in real time.
- Utilize reporting features in GA4 to visualize and interpret data. Employ GA4’s reporting features to generate interactive dashboards and identify significant trends in user behavior.
Summary
In conclusion, mastering website engagement rate GA4 empowers you to understand your users better and optimize your website for maximum impact. We’ve explored the nuances of defining engagement, identifying key metrics, and understanding influencing factors. Implementing the strategies Artikeld will ultimately boost your website’s performance and drive significant results.
